Single-Family vs. Condo: Key West's Two Different Markets
When I compare homes across Key West, from historic Old Town cottages to condo units near the Atlantic Ocean, the market tells two very different stories this month.
July 2026 Takeaway: Key West single-family closed sales held flat year-over-year even as new pending sales more than doubled, while the condo/townhouse segment saw closed sales jump sharply on a still-limited sample and median price move in the opposite direction of single-family.
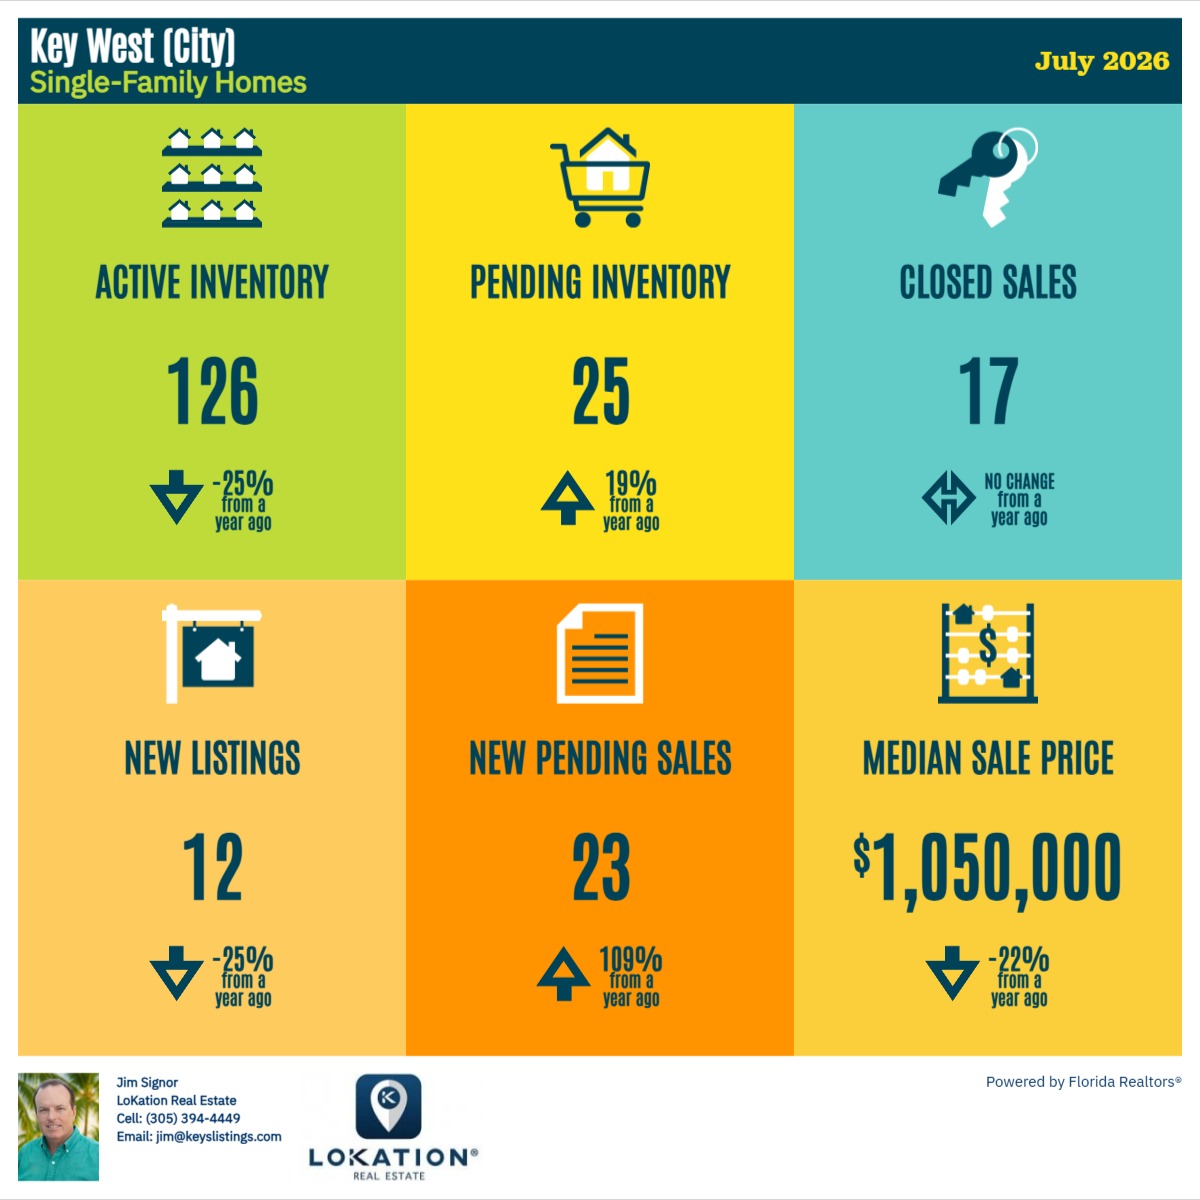
Key West Single-Family Homes: Steady Sales, Fewer Listings
| Metric | Value | YoY Change |
|---|---|---|
| Active Inventory | 126 | ↓ -25% |
| Pending Inventory | 25 | ↑ +19% |
| Closed Sales | 17 | No change |
| New Listings | 12 | ↓ -25% |
| New Pending Sales | 23 | ↑ +109% |
| Median Sale Price | $1,050,000 | ↓ -22% |
What I'm seeing on the ground: closed sales in Key West held exactly flat from a year ago, but new pending sales more than doubled, a sign that buyers are moving faster on the listings that do hit the market. At the same time, active inventory and new listings both pulled back, and median price came down with them.
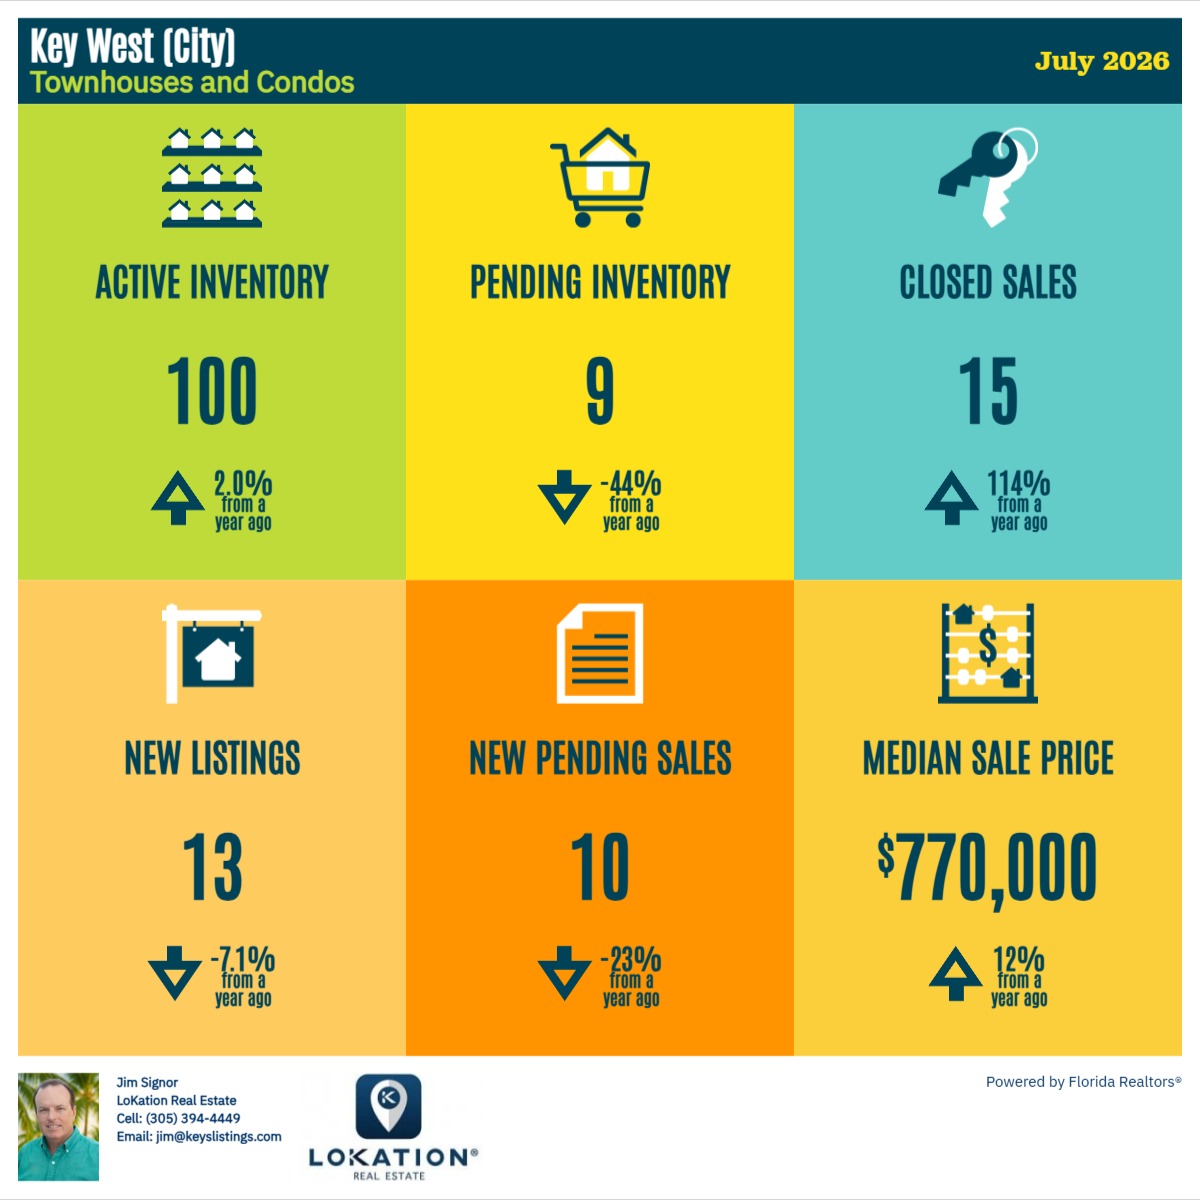
Key West Condos & Townhouses: Rising Sales, Rising Price
Key West's condo/townhouse segment moved on a smaller base this month, 15 closed sales. On a sample that size, a modest increase in closings can still produce a large percentage swing, so the +114% year-over-year jump in closed sales should be read as a sign of activity picking up rather than a fully established trend. Pending activity is telling a different story, though: new pending sales fell 23% year-over-year, a contrast worth watching against single-family's sharp gain in the same metric.
| Metric | Value | YoY Change |
|---|---|---|
| Active Inventory | 100 | ↑ +2.0% |
| Pending Inventory | 9 | ↓ -44% |
| Closed Sales | 15 | ↑ +114% |
| New Listings | 13 | ↓ -7.1% |
| New Pending Sales | 10 | ↓ -23% |
| Median Sale Price | $770,000 | ↑ +12% |
Single-Family vs. Condo: What the Contrast Tells Us
For buyers weighing a condo against a single-family home in Key West, the two segments are moving in different directions this month. Single-family still leads on active inventory (126 vs. 100) and commands the higher price point, with a median gap of $280,000 between the two segments. But single-family median price pulled back 22% year-over-year while condo median price rose 12%, and condo closed sales are closing the gap with single-family, 15 versus 17, on a much smaller active inventory base. The standout stat, though, is pending activity: single-family new pending sales rose 109% year-over-year while condo new pending sales fell 23%, suggesting buyer momentum is tilting toward single-family heading into next month, even as condos led July's closed sales.
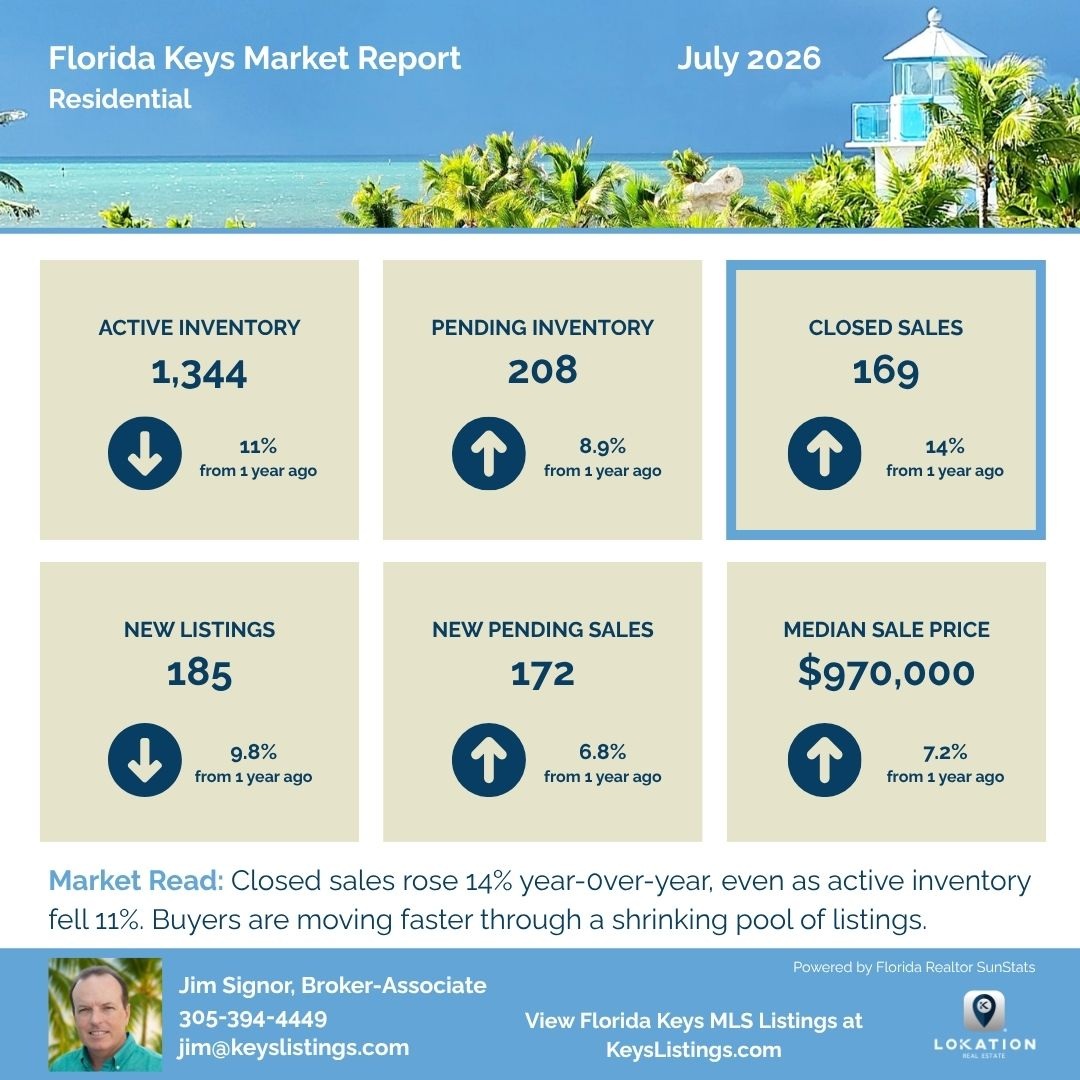
Want a county-wide picture? Read my most recent Florida Keys Real Estate Market Report.
Frequently Asked Questions About the Key West Real Estate Market
Is single-family or condo activity stronger in Key West right now?
Single-family homes lead in both active inventory and median price in Key West, and single-family new pending sales rose 109% year-over-year while condo new pending sales fell 23%, even though condos posted the sharper jump in closed sales in July 2026.
Why did Key West condo closed sales jump 114% while single-family sales held flat?
Key West's condo segment is a smaller sample, 15 closed sales in July 2026. A modest increase in closed units on a limited base creates a large percentage swing that reflects low baseline volume rather than a broad market shift.
How much less do condos cost than single-family homes in Key West?
In July 2026, the median sale price for Key West condos and townhouses was $770,000, compared to $1,050,000 for single-family homes, a difference of $280,000.